13: (5,5) Carbon Nanotube — Transport properties
-
Outline: Obtain the bandstructure, quantum conductance and density of states of a metallic (5,5) carbon nanotube
-
Directory:
tutorials/tutorial13/Files can be downloaded from here -
Input Files
-
cnt55.scfThepwscfinput file for ground state calculation -
cnt55.nscfThepwscfinput file to obtain Bloch states for the conduction states -
cnt55.pw2wanInput file forpw2wannier90 -
cnt55.winThewannier90input file
-
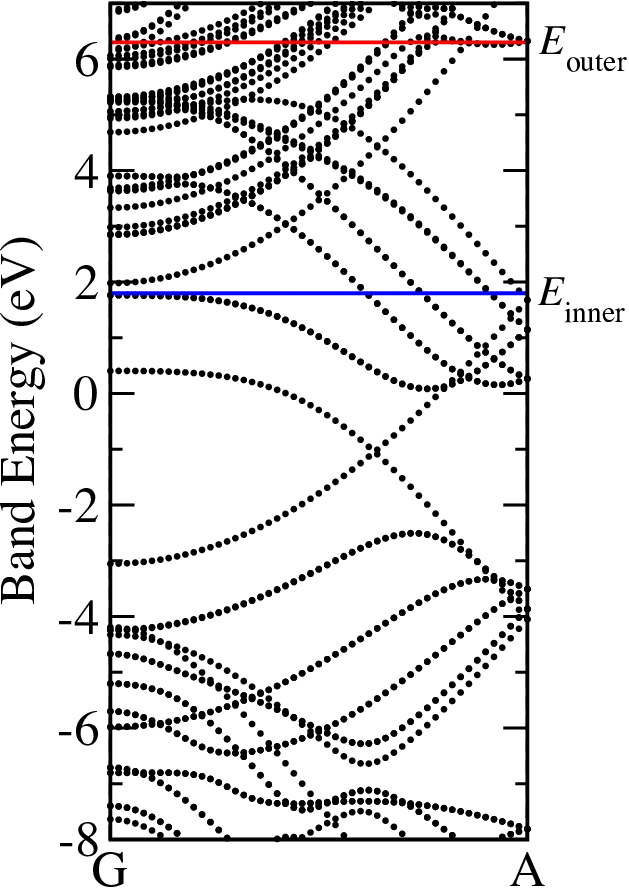
In order to form localised WF that describe both the occupied and unoccupied \(\pi\) and \(\pi^{\ast}\) manifolds, we use the disentanglement procedure to extract a smooth manifold of states that has dimension equal to 2.5 times the number of carbon atoms per unit cell 1. The positions of the energy windows are shown in this plot.
The part of the wannier90 input file that controls the transport part
of the calculation looks like:
transport = true
transport_mode = bulk
one_dim_axis = z
dist_cutoff = 5.5
fermi_energy = -1.06
tran_win_min = -6.5
tran_win_max = 6.5
tran_energy_step = 0.01
dist_cutoff_mode = one_dim
translation_centre_frac = 0.0 0.0 0.0
Descriptions of these and other keywords related to the calculation of transport properties can be found in the User Guide.
-
Run
pwscfandwannier90.\ Inspect the output filecnt55.wout. The minimisation of the spread occurs in a two-step procedure. First, we minimise \(\Omega_{\rm I}\). Then, we minimise \(\Omega_{\rm O}+\Omega_{{\rm OD}}\). -
Note that the initial \(p_{z}\) projections on the carbon atoms are oriented in the radial direction with respect to the nanotube axis.
-
The interpolated bandstructure is written to
cnt55_band.agr(sincebands_plot_format = xmgrin the input file). -
The quantum conductance and density of states are written to the files
cnt55_qc.datandcnt55_dos.dat, respectively. Note that this part of the calculation may take some time. You can follow its progress by monitoring the output to these files. Use a package such asgnuplotorxmgracein order to visualise the data. You should get something that looks like this.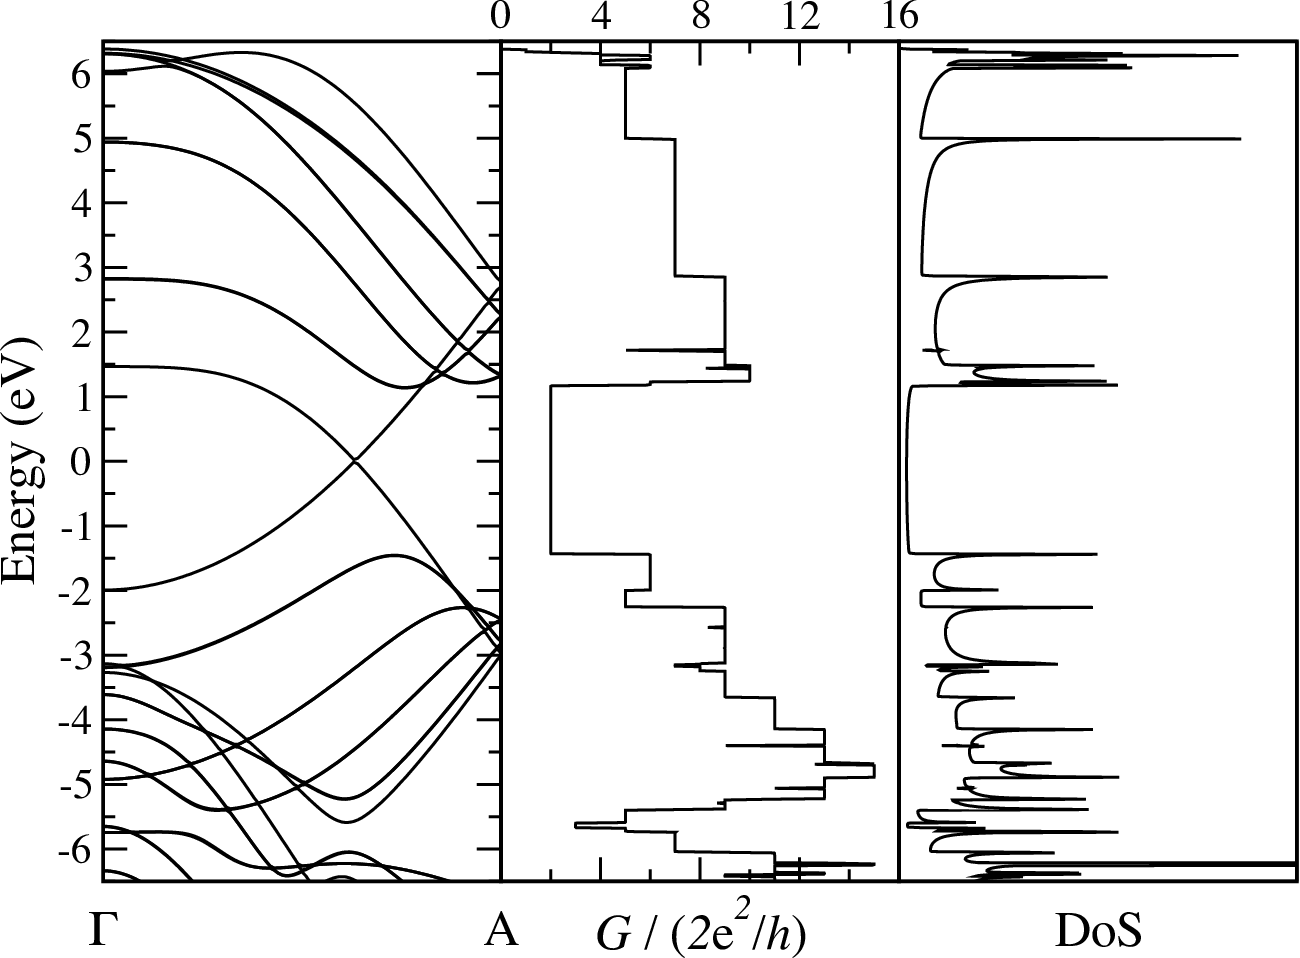
Wannier interpolated bandstructure, quantum conductance and density of states of (5,5) carbon nanotube. Note that the Fermi level has been shifted by 1.06eV with respect to the bandstructure plot.
-
Y.-S. Lee, M. B. Nardelli, and N. Marzari. Band structure and quantum conductance of nanostructures from maximally localized wannier functions: the case of functionalized carbon nanotubes. Phys. Rev. Lett., 95:076804, 2005. ↩