3: Silicon — Disentangled MLWFs
-
Outline: Obtain disentangled MLWFs for the valence and low-lying conduction states of Si. Plot the interpolated band structure
-
Generation Details: From
pwscf, using norm-conserving pseudopotentials and a
4\(\times\)4\(\times\)4 k-point grid. Starting guess: atom-centred sp\(^3\) hybrid orbitals -
Directory:
tutorials/tutorial03/Files can be downloaded from here -
Input Files
-
silicon.winThe master input file -
silicon.mmnThe overlap matrices \(\mathbf{M}^{(\mathbf{k},\mathbf{b})}\) -
silicon.amnProjection \(\mathbf{A}^{(\mathbf{k})}\) of the Bloch states onto a set of trial localised orbitals -
silicon.eigThe Bloch eigenvalues at each k-point
-
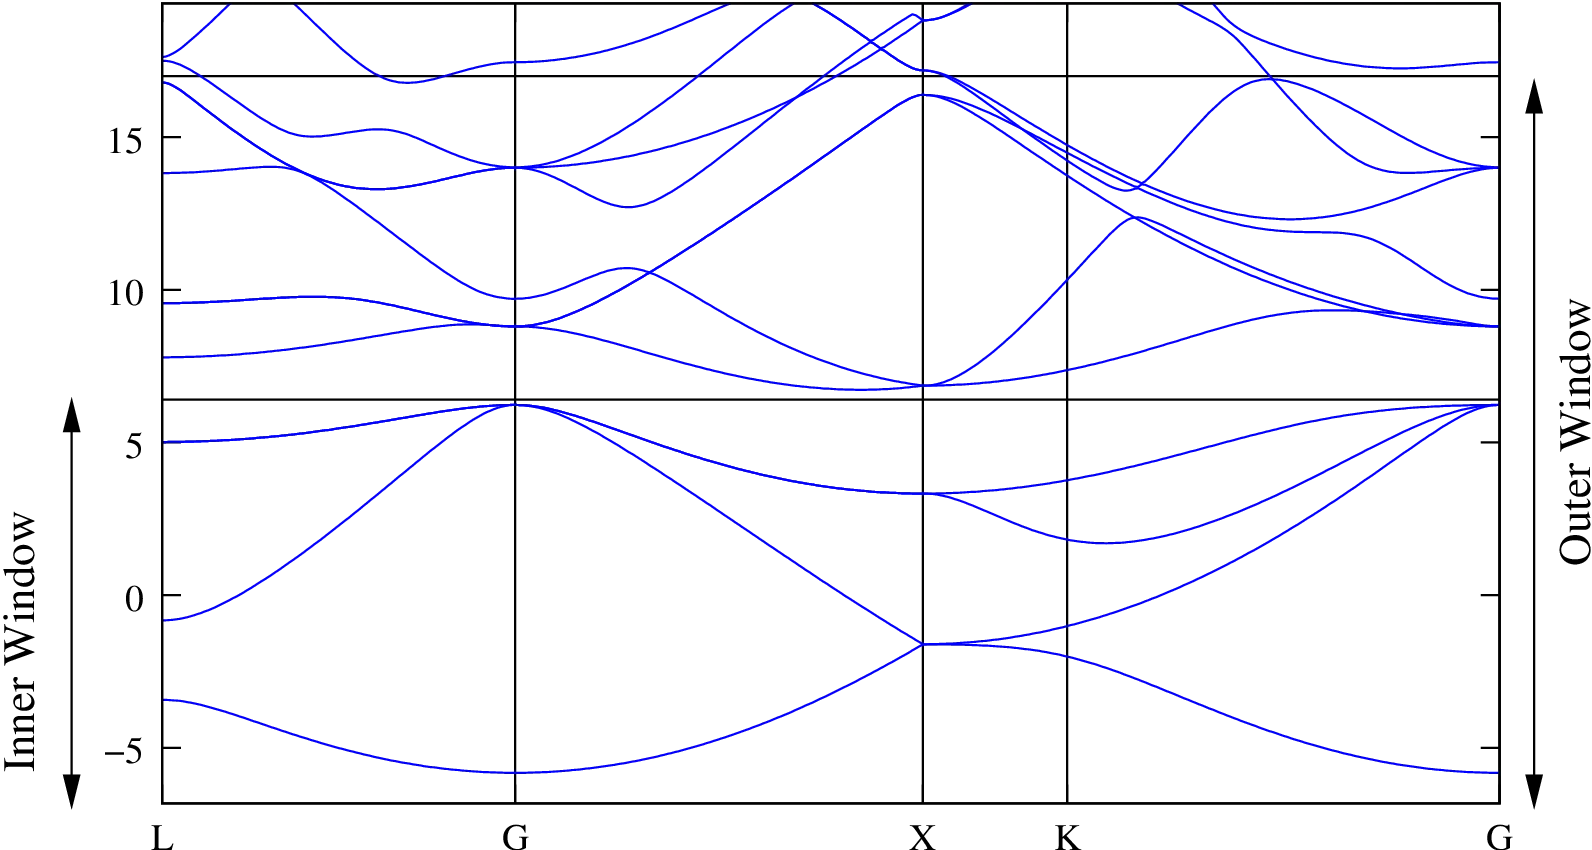
The valence and lower conduction states can be represented by MLWFs with \(sp^3\)-like symmetry. The lower conduction states are not separated from the higher states by an energy gap. In order to form localised WF, we use the disentanglement procedure introduced in Ref. 1. The position of the inner and outer energy windows are shown in the bandstructure plot.
-
Run
wannier90.Inspect the output file
silicon.wout. The minimisation of the spread occurs in a two-step procedure 1. First, we minimise \(\Omega_{\rm I}\) -- this is the extraction of the optimal subspace in the disentanglement procedure. Then, we minimise \(\Omega_{\rm D} + \Omega_{{\rm OD}}\). -
Plot the energy bands by adding the following commands to the input file
silicon.winand re-running
wannier90. The filessilicon_band.datandsilicon_band.gnuare created. To plot the bandstructure run gnuplotand within the gnuplot shell type
The k-point path for the bandstructure interpolation is set in the
kpoint_pathblock. Try plotting along different paths.